Updates provided by George Maynard – subscribe to the eMOLT newsletter here.
May 16, 2025 Update
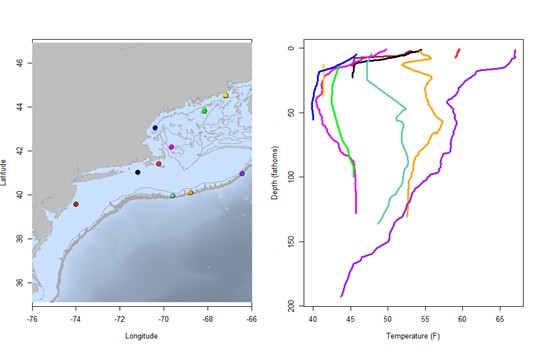
Temperature profiles collected by eMOLT participants over the week of 5/09/2025 – 5/16/2025. The blue profile is where the coldest bottom temperature was measured and the red profile is where the warmest bottom temperature was measured. All other colors are assigned randomly. Colored points on the map indicate where profiles of the same color were collected. The small dark green dots represent other profiles collected this week, but not highlighted in the plot. Note that the warmest / coldest bottom temperatures measured could have occurred during gear soaks, which are not represented on this profile plot.